What comes to mind when you think of Gen Z? Tech-savvy influencers? Social justice warriors? Instagram addicts?
In reality, 2022 data published by the Pew Research Center shows that Gen Z is the only generation that has seen a decline in social media usage since 2019. This excludes TikTok, which has seen positive take-up within the age bracket. There are several theories as to why this could be the case, with most attributing the demise to over-regular app updates wearing down younger users’ trust. Which begs the question; what cuts through the noise, and resonates with the “anti-social youths” of today?
It’s no secret that there’s a clear correlation between age and attention span. Those born into Gen Z have had access to a whole arsenal of technology from the get-go, which could explain the 8-second average attention span versus millennials’ 12 seconds. Now, we’re not talking NFT birth certificates, or Oculus Rift headsets in the highchair, but rather unlimited exposure to social feeds from an extremely young age.
With so many like-minded platforms competing for Gen Z’s ears and eyes, the content that resonates tends to be delivered on a shiny silver platter, requiring minimal thought power to process. With 96% of people immediately turning to videos to learn more about a product or service, animated or video content has always taken less thought-power to consume compared to text-heavy alternatives. So, when “Entertain me in 5 seconds” is the brief, TikTok delivers. Weekly trends, dynamic transitions, user generated filters and ranked audio libraries create the perfect storm for undivided Gen Z attention. And the oldies are playing catch-up. Instagram Reels and YouTube Shorts effectively provide the same platform, among their original format types.
Data capture can be dystopian as hell, but frankly, the internet would be a much tricker terrain to navigate without cookies – try working in Google’s incognito mode for a day and tell me otherwise. The same rings true for younger audiences online, where personalised shopping is now the norm. For them, trading personal data for an improved online experience is a no-brainer. Because of this, Gen Z can’t be fooled by generic ads with exhausted creative. Instead, marketers need to consider using guided quizzes, self-segmentation surveys, and on-site behaviour tracking to gather higher quality data on the details that matter most. Favourite brands, sizes, categories and colours are the specifics that mean the most when delivering the tailored content that they need. In turn, we can fine tune ads displaying similar products, offers and recommendations that they actually care about.
Gen Zers can sniff out branded content from a mile off. Having been targeted by social media start-ups, drop shipping sites and 30-day free trials* (*£59.99 pcm post sign-up) for the past decade, it’s fair to say they’re wise to the ins and outs of shameless paid placements. Which is why it comes as no surprise that, in order to win their trust, brands need to demonstrate integrity.
The obvious workaround for brands looking to build trust, and ultimately advocacy, is to work with influencers to develop less corporate, and more authentic comms. But when 44% of Gen Zers claim that comparing their lives to the unrepresentative lives of content creators has negative effects on their mental health, brands must be selective with their ambassadors. Influencer fatigue is real, and we need to adapt. The creators succeeding are those combining their aspirational regime with real-life causes they honestly care about. Why on earth would a vegan food influencer have a deep-rooted passion for carpet cleaner? Gen Z are fully awake to unrealistic brand partnerships, so always seek authenticity when developing an influencer strategy.
As some brands seek out authentic influencer partnerships, others are beginning to let down their hair a little on social. While an airline provider would traditionally designate their Twitter feed to more service-orientated content, Ryanair gravitate towards pop-culture, communicating entirely through memes. By recognising and owning the typical inferences that come with budget airlines, there’s no limit for Ryanair’s internet fame. Whether it’s quote tweeting ridiculous customer complaints, or commentating on the recent F1 drama, they frame their services in a relatable, almost charming way. Frequently nodding to ‘the admin’, they’re unafraid to remind the audience that there is indeed a human behind the account – encouraging interaction on a much more personal level.
Around 58% of consumers want to see more social content that makes them laugh. Often brands try to fill a social feed with uninteresting product or service centric messaging, which overlooks the main reason that users are scrolling: they want to be entertained.
Social feeds might serve the primary purpose of entertainment, but who said learning can’t be fun? From fashion to food, there’s no denying that social media can act as a source of education. YouTube is now the second largest search engine in the world, with over half of Gen Z internet users having watched a how-to video, tutorial video or educational video on the platform in the past week alone. Social now acts as the immediate solution for those everyday problems, while providing a dose of the good stuff that we didn’t realise we needed to know.
Mob Kitchen x Aldi’s Instagram Reels, Tifo IRL’s meticulous dissection of the beautiful game and Grace Woessner’s TikTok sofa flipping are all prime examples of social subcultures that can land with a Gen Z audience. Nothing is too niche; and if you’re posting about a relatively unknown area, make the content accessible and engaging for all.
Gen Z was always going to be a tough nut to crack. Behaviour on socials is evolving so quickly, it can be hard to keep up. We recommend taking the time to learn about Gen Z’s preferences and prioritise building long-lasting relationships that benefit all parties involved over those quick wins. Ready to optimise your marketing? Drop the saintnicks team a line here to get the ball rolling.
Our latest survey has found that most people (68.2%) do not recognise a Google Ad in their search results. This means that almost a third of us DO recognise the Adverts in our search results and almost 80% of those people (78.6%) will then refuse to click on the Ads.
Over the past six years , Varn have conducted research every six months to measure the degree to which people can recognise the Adverts within the Google Search results.
We work with our clients to hypothesise and evaluate holistic click through rates with and without the presence of a paid ads in the SERPs. Where possible we review the revenue per click generated by each channel in the context of search competition to identify the best search strategy. We are often reviewing data about click through rates on Adverts vs Organic listings, and we have always wondered who actually recognises a Google Ad when they search and what do they do then?
We all know how important advertising revenue is to Google. In 2021, Google’s ad revenue reached a staggering $148.9 billion. Add in YouTube advertising revenue and Google Networks advertising revenue, we have a total of £208.7 billion. This amounts to 81% of Google’s total revenue so, perhaps unsurprisingly, advertising and paid search is vital to Google. But how much do people recognise it’s advertising they see when they do a Google search?
We have been curious about this for some time and for the last 6 years, every six months in the UK, we have conducted a survey online asking over 1000 people across all age groups:
“Do you know which links on the Google search results page are paid adverts?”
Our research has highlighted that the majority of searchers (68.2%) still do not realise it is an Advert that is appearing at the top of their Google search results.

This is good news for advertisers, as this large proportion of searchers won’t be put off by anti-advertising perceptions, before clicking on your website. However, it does pose the question that if 68.2% don’t realise they are looking at an Advert, then 31.8% do recognise they are seeing Adverts in their SERPs.
Well, based on our latest findings, 25% of people do recognise it’s an Ad. They will then refuse to click on it. Only 6.8% of the people that recognise a Google Advert will then actually go on to click.
This means that 78.6% of the people that recognise Google Adverts, refuse to click on them!
This implies there is a large chunk of your potential market deliberately choosing to ignore your advert. With an estimated 3.5 billion searches per day in the UK alone, based on our findings, 31.8% of those searches, (1.1 billion) will know that there are Ads in their search results. Of those 1.1 billion searches, almost 80% of those searchers could be actively choosing not to click on your Ad. This is a large amount of people searching and making a conscious choice to ignore your Advert, precisely because it is an Ad.
Given we know these searchers will knowingly refuse to even look at your paid Ad, this means your business will need to try and engage with these people with other ‘search’ tactics. You simply can’t just throw budget at a paid media strategy alone, instead organic search will have an important role to play and a combined or hybrid search marketing strategy is needed.
From Google’s perspective they state that:
“Google’s first responsibility is to provide Search users with the most relevant possible results. If businesses were able to pay for higher rankings in the search results, users wouldn’t be getting the information they’re looking for.”
We examined how Google have presented Adverts to the searcher over time. Interestingly, since 2013, Google has changed it’s adverts over time to be less obvious. In the graphic below you can see how Google search Ads have evolved. The format and styling change frequently and it could be suggested that the graphic signposting of Adverts has become much more subtle over time and more in line with a standard organic listing.

When we look at our Varn research over the last 6 years, the ability to recognise an Advert hasn’t changed a great deal, even though theoretically people are getting wiser to how search engines work. It has remained between about 57% and 65% since 2017 and you can see how this may be influenced by the design of the Google Ad labelling which has since transformed to look more like regular Google listings. This year we see that figure at 68.2%, at a time when the Ad design really is very similar to an organic search listing.
Can you spot the difference…?
It really is not surprising that the majority (68.2%) of people still don’t recognise Ads, as if you line up a paid Advert and an organic search result and see how they actually look to a searcher, you can see there is not much difference at all:
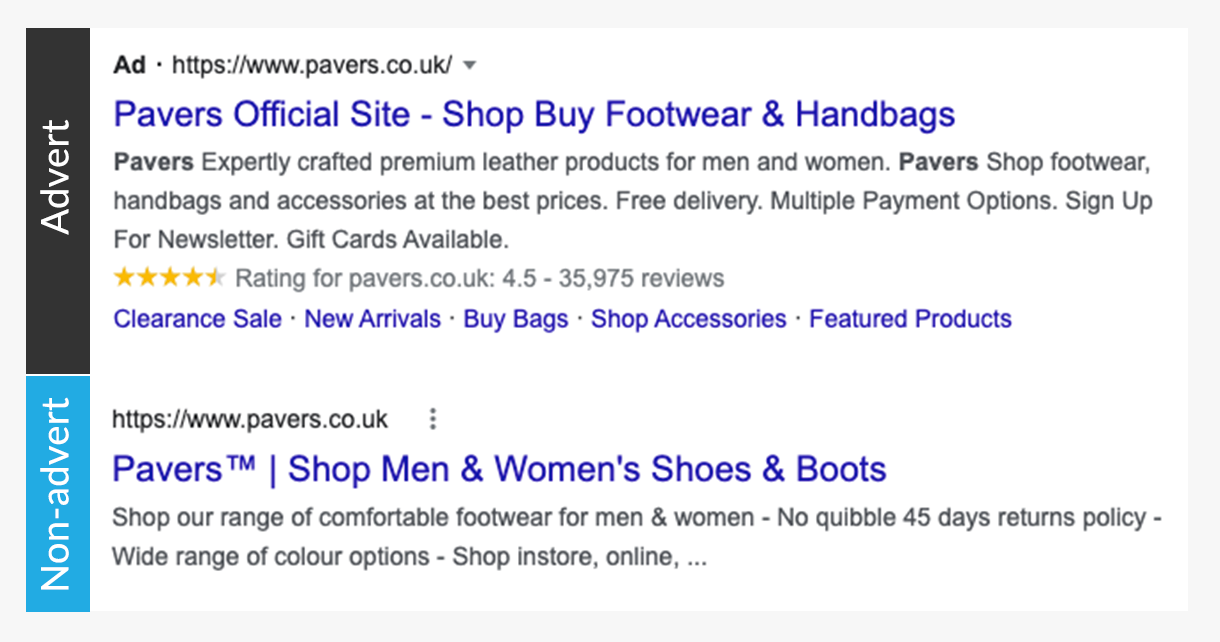
We have also seen that Ads can often take up most of the page of a search result. Combine this with the subtle design cues used to indicate the Advert status, you can see why people may not understand they are looking at just Ads rather than organic search results.
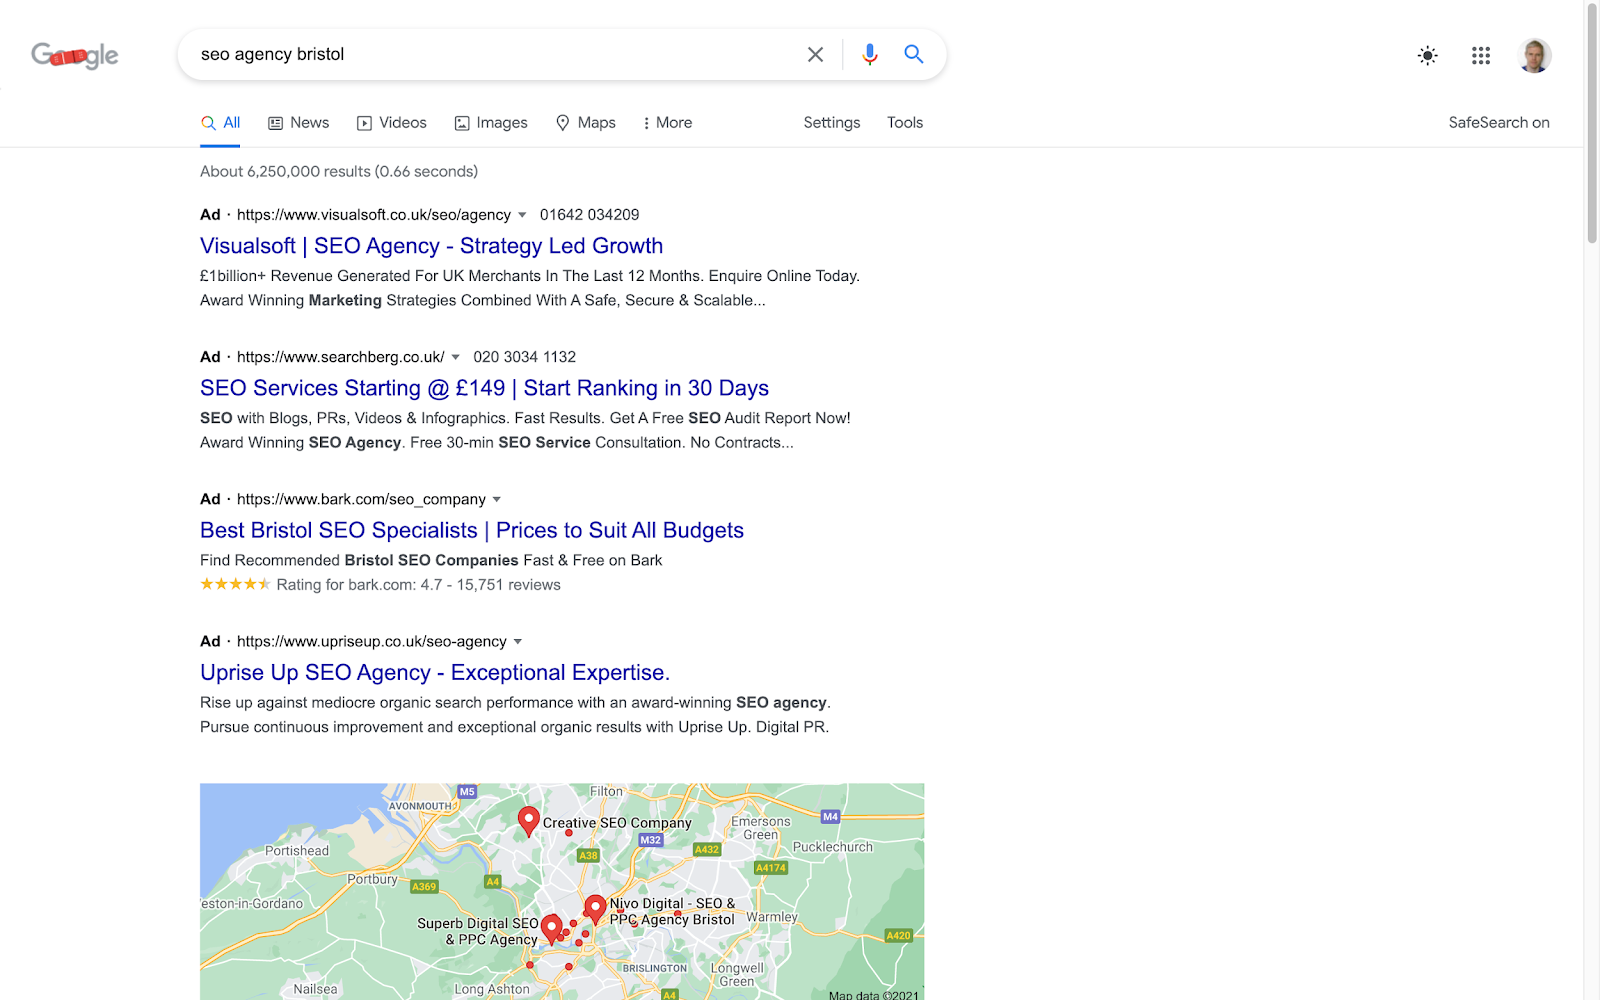
A good example is, if you search something close to our heart…. ‘SEO agency Bristol’. As you will see the paid Ads take up your whole screen when you initially search and you have to actively scroll down to get to the first organic search results. Given that 75% of people don’t scroll past page 1, those Adverts can really take up people’s attention and clicks.
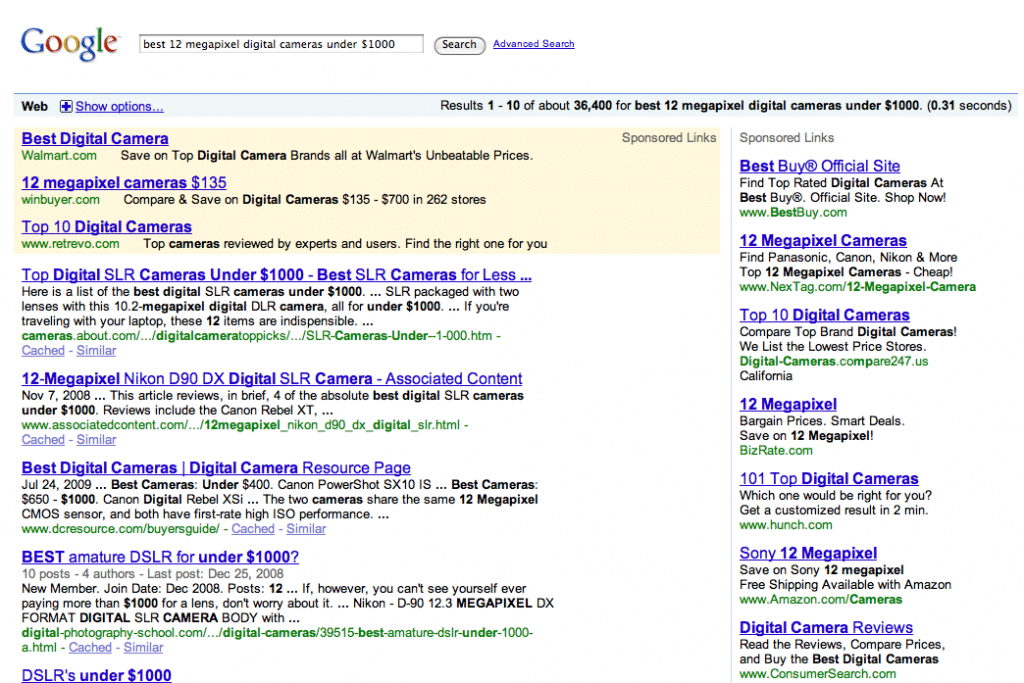
When we compare that back to 2009, these were the sorts of results you would see. It is really quite noticeable the the ‘Sponsored links’ are very clearly labelled.
In order to make sure your website is visible to the biggest search audience possible, it really is vital to make sure you have a search marketing strategy that embraces both SEO (organic search results) and PPC (paid search advertising).
We know from our ongoing research that the majority of the search market will not even recognise the Ad, and we can see from the examples of how Advert styling has evolved over time, why that has remained high. However, we know that we can’t ignore the large proportion of a target market who do know an Ad when they see one, especially as almost 80% of these searchers will then decide not to click. Therefore, it is critical to execute both SEO and PPC in the most optimal way possible, to ensure you are not missing out on potential clients.
Data suggests that approximately 53% of all website traffic comes from organic search and 27% from paid media,so it really is a sensible idea to not put all your eggs in one search basket. Neither organic nor paid search is inherently superior to each other and whilst paid ads do have a cost, you should be trying and testing both paid search and SEO, (with organic search optimisation, you’ll have to test for at least six months). By testing, reiterating and learning from both paid media and SEO, you can see what works for you and your business, short and long term, ensuring you capture all the possible clicks out there.
Given our latest research findings combined with the need to have a strategy that ensures you speak to the widest possible target search audience we have a clear recommendation. The best way to optimise reach and drive rankings and clicks, is to adopt both SEO and PPC strategies and tactics and to ensure you carefully plan and structure both for optimal results.
And Google seems to agree so we will leave the last word to them…
“Using SEO and Google Ads together may give you the best chance of bringing traffic to your site in the short term, and enhancing your business’s presence online for long-term success.”
Get in touch here to find out more about how to perfect your own hybrid model of optimised organic SEO combined with paid search media.
Having a strong organisational structure in place is key to growing your digital agency.
Whether your agency is brand new or has 100 employees, the structure of the team is going to have a direct impact on your overall efficiency, culture, client satisfaction, and scalability. Without a considered organisational structure in place, many agencies suffer from poor communication and frustrated team members and clients.
So, what are your options when it comes to structuring or restructuring your agency? How do you know which structure is going to guarantee both employee and customer satisfaction and give you the permission to scale your marketing agency?
Get more brilliant advice from Janusz at the 12-month Mastermind group for agency leaders. Gain momentum, resolve and focus to achieve your goals, with the support, accountability and insight of GYDA experts and like-minded peers. Find out more.
1-Flat
A flat team structure is common in smaller agencies and start-ups. Flat structures have only a couple levels, if any at all, between management and employees. These organisations tend to require employees to ‘wear many hats’ and as such, often produce a lot of generalists but no specialists.
2-Functional
Then we have functional structures — in which teams are organised by services. For example, a digital agency with a functional structure could have a Social Team, an Email Team and a PPC Team, and so on.
A functional structure concentrates the expertise and knowledge within those services or groups. As such, this structure often falls down when the client requires more than one service from the agency, forcing disjointed communication between the executives in each team.
As the agency grows, communication and coordination between these teams is only more and more convoluted and scaling becomes very clunky and difficult.
3-Matrix
A matrix structure is similar to a functional one, with added levels of management and communication weaved into the mix, hence matrix.
This structure involves side-ways communication between team members, like account managers who coordinate other functions. Like the functional structure, the matrix is limited to a team of a certain size, as this web of communication is difficult to scale.
4-Holacracy
Holacracy organisational structure is where there are no clearly assigned roles. Employees are given the flexibility to take on any duty or role and move between teams freely. A holacracy can work well within some industries, but broadly speaking, this structure is a poor fit for all digital agencies as having expertise and specialism within your personnel is essential.
5-Pods
A pod organisational structure is where an agency arranges their teams by client type or sector, rather than the agency function or service.
This creates specialist teams, which function similarly to sports teams. For example, each ‘Pod’ would have a PPC expert, an SEO specialist, and a Social Media manager and this pod would service a particular category or type of clients, such as Automotive Clients or the Legal Sector.
Watch: A detailed look at Functional Structures Vs Pods (4min)
Utilisng a pod structure allows you to lean into your niche and achieve a deeper level of industry or sector specialism from each pod.
Pod structures also have no dependencies on other teams within the agency, thus there is no web of complex internal communication. This creates friction-free workflows within your teams and an enriched experience for your clients at the other end.
Finally, a pod structure creates accountability and responsibility among your team members. As employees are being regularly challenged by exciting projects within their specialism, they are likely to have increased job satisfaction levels.
At Digital Agency Coach, we advocate running weekly or bi-weekly workshops for all specialist executives, hosted by a technical lead. Keep the agency focused on strategy, process improvement and professional development and create a conversation the other experts from each pod.
Regularly hosting these casual, friendly and engaging workshops with employees of the same skill set promotes an easy and productive conversation with relevant learning and take-homes for each employee.
There’s no denying restructuring your digital agency can be a disruptive process in the early days and it probably won’t happen overnight. But once the hard groundwork is done, growing and scaling your agency can simply be a matter of copy and pasting a new pod.
This team structure eliminates the complex web of communication just as effectively as if you have a team of 30 or a team of 300 people.
If you are a full-service agency and your clients are purchasing multiple products or services from you, perhaps it’s time to reconsider your organisational structure.
Watch Our Quick Functional Structures vs Pods Explainer Video (4min)
If you feel you’d like any help or guidance with restructuring your agency, get in touch with Digital Agency Coach to arrange a consultation, we’d be delighted to help.
Get more brilliant advice from Janusz at the 12-month Mastermind group for agency leaders. Gain momentum, resolve and focus to achieve your goals, with the support, accountability and insight of GYDA experts and like-minded peers. Find out more.
Blog writing for business is one of the most effective marketing tactics B2B organisations can deploy. It draws traffic to your site and provides buyers with useful information. The effects of blogging are cumulative: the more you do it, the better it gets. And – most important of all – it’s a channel you own. You’re not beholden to anyone or any other business, it’s your space to do with as you will. In an age of scattered attention and ever-changing social media algorithms, that’s a precious commodity!
Here’s why writing a blog for business is a worthwhile investment.
A business blog shows people that you’re credible, that you have something to say and you’re willing to share it. This transparency helps to build trust with your potential clients.
Trust cannot be underestimated when it comes to winning over B2B customers. These are savvy buyers and they want reassurance that you’ll do what you say. Get it right and blogging is most definitely good for business. According to research by FocusVision, 65% of B2B buyers say that vendor websites are influential in their decision making – more than any other type of content. A regularly updated blog ensures your website stays relevant for those potential customers: it provides them with answers to their questions and gives them confidence in your offer.
A blog on your site is important for business because you own it! Your business blog is your space. Unlike the rented space on social media, your blog belongs to you. It’s not at the mercy of sudden algorithm changes. And there’s no risk of a favourite feature suddenly disappearing and taking your audience with it.
According to information published via HubSpot, a blog is in the top three owned media channels for B2B marketers, along with a website and an email newsletter. Blogs drive traffic, increase visibility and generate leads. While they take a little work to maintain, the payoff is an engaged audience, buyers that trust the brand and more opportunities to do business.
Blogging for business and SEO go hand-in-hand. Google loves authoritative websites – sites that it perceives users find helpful. The figures are hard to ignore: blogs can lead to a 434% increase in indexed pages and an increase in indexed links of up to 97% (DemandMetric).
And while technical chat isn’t exactly a turn-on for all of us, a site that ranks means a better chance of ending up in front of the right people. 55% more people, as HubSpot estimates that’s the uplift in website visitor numbers among businesses that blog versus those that do not.
A consistent schedule is critical when writing a business blog. The frequency depends upon your industry, your audience and how often you can reasonably commit to writing. There’s no point making a commitment to blog daily if you know that doesn’t work for your schedule. It’ll only set you up for failure, cause you to feel disheartened and scupper the blog’s future before it’s begun.
If you’ve never blogged for business before, then a blog per month is a great place to start. A blog each month keeps your content fresh and your audience engaged without taking over everything else. A once-a-month schedule is especially good for businesses with small teams or solopreneurs who want to create content, while still having time to actually do their job.
If you do have the capacity or resources to blog more often, do it! There are no hard and fast rules. If it works for your audience and meets your goals, you can write blogs for your business as often as you like.
No matter how often you blog for your business, the key is to stick with it. If content is King, then consistency is Queen! Remember, the aim of blogging is to build trust between your business and your audience. And while showing your hand in the form of content does build trust, so too does doing what you’ll say you’ll do. If you commit to posting once a month, then do it. If you commit to posting every week, do that.
Blogging delivers results. It must do, or why would businesses keep investing in it when there are many other demands on marketing budgets? Short articles of less than 3,000 words were ranked third among the B2B content that generated the best results, according to the Content Marketing Institute.
And while blogs are a great way to draw traffic to your business’ website, you don’t have to wait for people to come to you. Pair your blog with a regular newsletter and you’ve got a powerful duo: ‘1,000 small business owners ranked email marketing as the second most effective medium for building brand awareness’ (Campaign Monitor, 2019).
Like your blog, your newsletter list is your property. It’s made up of people interested in what you do, who trust you enough to give you their details. Don’t ignore them. Deliver your blog to your newsletter list and build a relationship based on shared knowledge and mutual respect.
Blog writing for business has many benefits. It nurtures a relationship between your brand and your audience, builds trust, draws traffic to your site and increases opportunities to do business.
To succeed with blogging for business, keep the following in mind:
Laura Summerhayes is the owner of and copywriter-in-chief at Great Copy Matters. Working with B2B service businesses, Laura crafts compelling, engaging copy that lets people know why they should work with you. Like the idea of a regular blog, but prefer to let someone else do the hard work? Feel free to get in touch to discuss how writing a regular business blog could benefit your brand.
Every brand has an online reputation, and a quick Google search may reveal more about your business than you’d like.
Digital accessibility has made it easy for potential customers to find out more about a brand online. This is why your brand’s online reputation matters.
Online reputation management is also known as ORM. It’s the process of monitoring and managing the public perception of your brand by taking control of online conversations.
You can do this in a variety of ways, from encouraging positive reviews to dealing professionally with negative feedback. Your brand’s reputation is not just manageable, but it’s also malleable and now your customers can do more than search for information, they can add to it.
Business owners are becoming increasingly aware that their brand is almost entirely shaped by the consumer. The best marketing and PR agencies understand that it’s not only important to include the consumer but to work with them to cultivate a positive brand image.
Online brand reputation management can help you deal with negative search results and strengthen a positive reputation for your brand. ORM can also modify the way you appear in search results.
This is what the strongest brand management strategies do best.
The first step to boosting your reputation online should always be to conduct a brand audit. This involves conducting online research to help understand how your brand is perceived.
This will help you:
ORM involves using tools to actively monitor your brand mentions, attempting to eliminate as much online criticism as possible. It broadly falls under the influence of search engine optimisation (SEO).
SEO attempts to build a strong portfolio of optimised content to increase the visibility of your brand on search results. Optimising your online content so that it appears on the first page of results is now a crucial requirement, 75% of searchers won’t look past the first page of Google search engine results for any queries.
More customers than ever before are relying on online reviews, as a form of third-party endorsement, to help them make purchase decisions.
While it’s always great to receive positive customer feedback, negative reviews are an inevitable part of online visibility.
It’s always easy to become defensive but it’s always best practice to answer a negative comment quickly and professionally. 93% of customers read online reviews, and 89% of consumers read company responses to reviews.
Being seen as being responsive and proactive in the face of criticism is an excellent way of building endearment and loyalty towards your brand.
Social media marketing is an essential part of ORM strategy.
Social media channels and PR are based on communication and engagement. This is why they are so effective when used together. As social media presence grows, so does the opportunity to cultivate a persona that will satisfy target markets.
There are plenty of opportunities for online reputation management on social media. Simply cultivating social media interactions, and being present and visible, will allow you to create and grow your online visibility.
ORM and public relations go hand in hand. While traditional media is still very much a part of Public Relations, PR’s remit very much covers online reputations.
Using a combination of methods, not dissimilar to digital marketing, PR utilises online platforms to manage your online reputation. Services include content marketing to improve ranking in search results, SEO, influencer marketing and crisis management.
PR’s central focus is the strategic planning of communications. Be it through media relations, social media and digital platforms, a strategic approach to PR can help develop better relationships and do more to protect your brand reputation online.
Brand monitoring is an incredibly effective way to manage your business online. By setting up alerts for your brand name, and related keywords, you can monitor any mentions as they happen.
Knowing where and how your brand is being mentioned online, allows you to react quickly and be responsive on social media, review sites, blog posts and forums.
The faster you can contain and respond to online negativity, the better. It’s perceived as more professional and more caring. But it isn’t all negative, monitoring brand mentions will also help you share and promote any positive content that might come through from third parties.
Online reputation management is constantly evolving as digital channels grow and change. To ensure business success, your online reputation must be cultivated, maintained and monitored constantly.
Executing your online brand reputation management strategy is far more straightforward when you have a host of tools to help.
Google Alerts, Buzzsumo, Brand Watch, Meltwater and Semrush are some of the tools used by ORM professionals for maximum results. Like any tools, of any trade, they are most effective when in the hands of an expert.
Online reputation management is constantly evolving as digital channels grow and change. To ensure business success, your online reputation has to be cultivated, maintained and monitored constantly.
In the past 3 years, eCommerce businesses have experienced the impact of a number of global crises.
Right now, we’re still living through the aftermath of a global pandemic, rising inflation, and the war in Ukraine. And these global events have shaken even the most successful eCommerce brands.
Over the past 6 months, retail brands have started losing some confidence in marketing spend amid worries of a bleak future. However, knee-jerk reactions can do more damage than you think.
There are opportunities for those brands willing to invest. And to help you through these turbulent times, we have released a new guide – Global Issues: The Threats Affecting eCommerce.
You can download it free here. Or scroll down to find out more about everything included in the guide before you make up your mind.
In our latest guide, we take a closer look at the global crises impacting eCommerce brands, how brands can react and excel in these uncertain times, as well as the top 5 trends defining the eCommerce landscape in 2022.
It covers…
Digital advertising revenue reached $189 billion in 2021, jumping 35% – the highest increase since 2006.
But as we’re sure you’re aware, the picture is not rosy for many retail brands. Inflation, war, pandemics, and supply chain shortages have all created a difficult terrain for brands to flourish.
Consumers have responded to these crises by cutting back on their spending. The less people are willing to spend, the less people will be actively clicking on your ads.
The future eCommerce landscape looks tough. But there are still opportunities out there if you focus on the marketing trends that are emerging. It’s these trends that will help you succeed in 2022 and beyond.
You can get a free copy of the guide here. And if you have any questions, feel free to drop us a message.
The founders of The Big Plastic Count – Greenpeace UK and Everyday Plastic – appointed purpose-driven creative agency, Enviral, to create its latest national campaign, which has lifted the lid on the country’s recycling rates and exposed that the government is talking trash about our plastic problem.
Through their launch video, The Big Plastic Count and Enviral encouraged 31 MPs and 97,948 households to take part in counting their plastic for a week in May, which equates to 1 in every 262 households in the UK. This was the biggest ever investigation into UK household plastics and the data uncovered will be crucial in convincing the government, big brands and supermarkets to take ambitious action on reducing plastic packaging.
Throughout the investigation, participants counted over 96 billion pieces of plastic and uncovered that only 12% of our plastic waste is actually recycled with 17% exported abroad, 25% sent to landfill and 46% incinerated.
Working in close partnership with the The Big Plastic Count team, Enviral developed the creative, the narrative and oversaw the shoot productions to create three hard-hitting films; a launch film, a how-to film and a shocking results film which puts pressure on the government to act.
Chris Thorne, Plastics Campaigner at Greenpeace UK said: “The plastic crisis is out of control but if the government acts we can get a grip on the problem. That’s why The Big Plastic Count is so important. Getting the narrative right on a campaign like this can be make or break. Through Envirals understanding of our needs and their collaborative approach they’ve helped us create assets we know the public will connect with and will lead to more and more people pushing the government to take ambitious action to end the plastic waste problem.
Joss Ford, Enviral Founder, comments: “We’ve been consistently beating the drum around the role of creatives in fighting the climate crisis and in connecting hearts and minds. So being able to partner with such an impactful organisation like Greenpeace UK really is a huge moment for our team and one which we hope brings real impact and holds those in power to account.”
This project embodies Greenpeace UK’s wider mission to defend the natural world from destruction, with a vision for a greener, healthier and more peaceful planet that can sustain life for future generations to come. The campaign evolved out of The Everyday Plastic Survey, pioneered by Everyday Plastic, a research-led non-profit focused on evidence-based education and campaigns. With the aim of mobilising and inspiring the UK population to help lift the lid on our recycling, it’s hoped this campaign will hold the government to account and bring real, positive change.
Enviral was awarded the contract after a competitive pitch process. With previous agency nominations including The Drum’s Best Use Of Video For Digital Advertising, Enviral is a full-service ethical brand communications agency based in Bristol that leverages the power of storytelling to effect real change for future generations.
Watch the launch video in full here.
According to HubSpot, marketers that blog consistently are 13 times more likely to see a positive return on investment. Business blogs are a fantastic way to make your marketing spend go a long way, but the generation of content is an ongoing commitment.
Idea rich, time poor
Many small business owners and marketers for larger organisations have lots of ideas they would like to implement but little time to implement them. They have multiple balls in the air at any one time, including clients, prospects, and media outlets, so keeping the business blog up to date can be hard. Some may feel like it’s enough to post every now and then when they have time, while others want to do more but simply can’t justify prioritising it over existing and potential clients’ needs. I know how that feels. I have my own blogging business, so my blog is an important part of my portfolio, but when I have multiple client deadlines to hit, of course I am going to prioritise their needs over my own. However, that’s not to say that neglecting your business blog is a good move.
Drive traffic and build trust
Consistency in business blogging is an excellent way to drive traffic to your website and promote your brand. It also builds trust with your target audience as they continually see that you are supplying useful information to them. If blogs appear on an ad hoc basis, they don’t receive the same recognition from Google, but they also don’t create the same perception among web visitors. People buy from people they trust and a business blog is a bit like providing a window into your business, for prospects to peer through to get an idea of what it’s like inside. If there are reams of useful information that have clearly been updated regularly and recently, it paints a picture of a company that is up to date, on trend, and in touch with the market and its customers. If there is a blog with the most recent post dating back to last year, you probably wouldn’t come away with the same impression.
Hold onto the visitors you get
Additionally, a consistent business blog is a good way to keep visitors on your site because you can direct them from one article to the next, to the next, and before they know it, they have spent half an hour delving into your knowledge and expertise. This only works with a well populated blog though. If you only have a handful of posts spread over the course of a few years, visitors will soon realise that much of the information they’re reading is outdated and go elsewhere to find what they need.
Keeping visitors on your site for longer allows them to build a better picture of who you are and what you stand for. Think about the difference between meeting someone in person for 30 seconds, and spending time with them for 30 minutes. While first impressions do count, the longer you can engage with your audience, the more chance you have of selling your expertise and building trust in your brand.
Budget for blogs
Regular blogging is also better financially too. If you outsource the copywriting of your business blog as many companies do, it may feel easier to commission a blog every now and then, but it’s far better value for money if you commit to a regular program. As well as ensuring you have a consistent blog on your site, if you establish an ongoing commitment with someone, you know there is a third party who will drive the schedule on your behalf, chase for any information they need, and make it happen with minimum hassle. All for a set monthly fee that you can budget for without worrying about variable fees from one month to the next.
So, when it comes to the question of ad hoc vs regular blogging, it really is best to keep it consistent.
With 81% of people in the UK today saying that creating a well and healthy world is the biggest challenge of the 21st century and 52% of people in the UK saying that they have felt more unwell since the beginning of the pandemic, the immense scale of the task ahead is very clear.
To further explore this growing challenge, last week (April 28th), McCann Bristol and McCann Synergy hosted the second Talks on Toast event of the year, Truth About Wellness.
Hosted by Kathryn Ellis, Managing Partner, Strategy at McCann Bristol alongside Rodney Collins, Director at McCann Worldgroup Truth Central and Chloe Foy, Behavioural Strategist and ACC Coach at McCann Synergy, the event uncovered research based on 10 years of trended global data about the shape, role and meaning of wellness in consumer lives across 26 global markets – uncovering insights around mental, physical, emotional, financial wellness and much more.
Focusing on wellness both today and tomorrow, the research timeline demonstrated huge shifts in consumer behaviour from before the pandemic through to now. A large emphasis was placed on how far wellness has come in the last decade and the importance that is now placed on this for both customers and workforces.
With 74% of people saying they’re definition of wellness has evolved in the past year, what does it mean to be ‘well’ in today’s world? The insights uncovered suggest wellness remains multi-dimensional, however the definition of wellness we are familiar with needs to expand. Rodney talked through the eight dimensions of wellness including; emotional, financial, spiritual and social, with the focus drawing more now on how a sense of lack in one area can negatively impact another.
Rodney commented: “We’re really noticing that in the past 10 years what has shifted is that each of these dimensions appeared to exist in a silo, there was no mention about how ones mental health could impact ones physical health, how the bacteria in our stomachs affect how happy we are, how loneliness increases our chances of developing heart problems, or how the hitting costs of urban ride sharing is increasing environmental pollutants, which in turn are driving higher rates of Asthma. So the wellness conversation today has really become expansive, interconnected and networked.”
The discussion continued by identifying the erosion of this siloed approach, delving into the evolution of the wellness conversation and addressing five key additional shifts brands and businesses should foster and strive for to ensure a positive wellness evolution in the workspace.
Talks on Toast is a quarterly event hosted by McCann Bristol, delivering insight and global research at a local level based on key global topics.
Here’s a great story courtesy of MailChimp.
“In 1978, a marketing manager at Digital Equipment Corp named Gary Thuerk used this new method of direct communication to send out the first commercial email to let people know about a new product. His email list only had 400 addresses, but the emails he sent resulted in about $13 million in sales.”
This was only 7 years after the first email ever was sent in 1971, and being the first person to do anything in marketing is a pretty incredible feat. Nowadays, more than half the world’s population has an email account – and most of them are more than happy for the brands they love to take up space in their inbox.
Email marketing is an all-encompassing term for sending promotional and commercial emails to a list of subscribers who have given you permission to do so. This includes newsletters, updates on special offers and events, welcome emails, abandoned cart emails, order confirmations, delivery updates and lots more.
Email marketing often takes a back seat to the ever-present social media marketing, but it’s still a major player in the mix. I am a big fan of email marketing, and by the end of this post, I hope you will be too!
There were 4 billion emails users in 2020, with about a 3% increase each year. In comparison, there were 3.6 billion social media users in 2020, and these days we regularly see large numbers of people shifting to new platforms or giving up social media completely.
73% of millennials say email is their favourite way to receive communication from businesses.
44% of users check their emails to find deals from brands they like, compared to just 4% who would go to Facebook for a bargain.
Still not sold? How about this: email marketing has a return on investment (ROI) of 3800%. You’d be hard-pressed to find a figure like that anywhere else.
1. Segment and Personalise
Segmentation is the process of separating your contacts based on a number of different factors. Personalisation is using those factors to engage people in a way that will resonate with them.
Here’s a very basic example. You sell candles, and you offer shipping across the UK. Your purchase process contains an opt-in form for your newsletter, so most of your past customers are on your mailing list, and you’ve segmented them geographically. Now you’re planning an event in Bristol, and you want to get the word out. It’s probably not worth sending that email to your customers in Edinburgh. I’m sure your candles are good, but they’re probably not ‘travel 400 miles to get one’ good. Especially if you can buy them online and get them shipped out. So we can send a personalised email along the lines of “Bristol customers, come to our event and make your candle dreams come true!”.
According to SendinBlue, there are four main types of segmentation.
Demographic – concrete information about who contacts are (e.g. age)
Psychographic – subjective characteristics of contacts’ personalities (e.g. values)
Behavioural – contacts’ past interactions with your business (e.g. abandoned cart)
Geographic – where contacts are located (e.g. timezone)
As you can see, these are pretty broad and the possibilities are vast. Revisit your email marketing goals to figure out what would be most beneficial for your business.
2. A/B Testing
Should I add that emoji to the subject line? How about another paragraph of copy – would that lead to more clicks? They say the little things can make a big difference. Luckily, A/B Testing helps you figure out which little things actually work.
A/B testing is a clever little tool that allows you to send two slightly different campaigns to your audience. Then you can look at the data and find out which performed better, and use this knowledge to make better decisions in the future.
As business owners, we feel like we have to have all the answers. But sometimes A/B testing can prove our hypotheses wrong. Don’t be disheartened – instead, think of it as an opportunity to learn more about your customers.
Here are a few things you can A/B test:
Subject line – (long or short, emojis or no emojis)
Content – (more or less copy, more or fewer images)
CTAs – (how many, where are they placed)
Schedule – (day of the week, time of day)
3. Clear Out Your List
Chances are, you’re paying for your email marketing provider per contact on your list, so make sure those people are worth it! If you haven’t used your list in a while, start with a retargeting campaign to draw people back in with an enticing offer. After a while, clear out any contacts that haven’t interacted with your emails at all. Make this a regular habit to ensure your list is always up to date.
4. Optimise for Mobile
Over 70% of people prefer to read emails on their mobile, so don’t forget to check the mobile version before hitting send. The good news is that 1 in 5 commercial emails are not optimised for mobile, so getting this right could help you stand out from the competition.
Here are a few things to consider before scheduling that campaign.
Mobile devices will show just 25-30 characters of a subject line, so keep it short or make sure your key points are included at the beginning.
Some email apps don’t show images by default, so think of any images as a bonus, rather than the main event.
Make your CTAs clear enough to show up on a small screen, and big enough to easily accommodate a tap from a fingertip.
Test before sending! Always send a test email and view it on as many devices as possible before you hit send.
5. GDPR
GDPR legislation can feel super intimidating, but don’t be afraid. Essentially, its purpose is to give people more control over their data, and it certainly doesn’t spell the end of email marketing. If anything, it means those people who choose to give you their data are going to be even more engaged with your business, leading to a more valuable list.
A few things to consider here:
Make sure everyone on your list has given clear consent to be contacted by you, and keep evidence of this consent.
Only ask for the data you really need (this is important both for GDPR compliance and to maximise sign-ups, as a long form will put a lot of people off).
Use a reputable email marketing platform (MailChimp is great for beginners), and a lot of the complicated stuff will be taken care of for you.
Of course, by entrusting your email campaigns to Turnhouse, we can put all this into practice for you. Find out more about email marketing and the services we offer.
You need to load content from reCAPTCHA to submit the form. Please note that doing so will share data with third-party providers.
More Information